TL;DR
Automation delivers value only when test results are visible, timely, and easy to act on.
This article covers:
While working on the HME360 project, we identified a clear gap in how test automation results were being consumed. Automation was running, but visibility into progress and quality was fragmented and slow.
Key Challenges We Observed:
- No centralized view of automation status across test cycles
- Test results spread across multiple tools and formats
- Manual effort required to compile and share reports after every run
- Delayed feedback for stakeholders and leadership
- Limited insight into test quality during sanity and regression cycles
To address this, we designed and implemented a customized automated HTML and PDF reporting framework, integrated with Azure DevOps CI/CD pipelines, that provides real-time visibility into every test execution — from sanity runs to regression cycles.
What We Built (And Why It Worked)
Many teams rely on automation tools but struggle to turn execution data into meaningful insights. Our approach solved this by combining multiple technologies to generate structured, easy-to-understand reports that automatically reach all stakeholders after each test run.
Here’s how we built it:
- Ranorex Automation Helpers were used to generate HTML and PDF reports with clear module-wise summaries (Pass/Fail counts, totals, and percentages).
- Each execution includes detailed machine, OS, browser, and environment context, giving a complete snapshot for audit and traceability.
- Using SMTP integration, the framework automatically emails reports to relevant teams — attaching both .rxlog and .pdf files after every run.
- Integrated into the Azure DevOps CI/CD pipeline, this ensures that after each build deployment, automated tests trigger instantly, and results are distributed without manual effort.
- The same framework also supported the client’s Angular migration, where we extended reporting to include a structured list of functional and styling issues, categorized by module and severity for easier tracking.
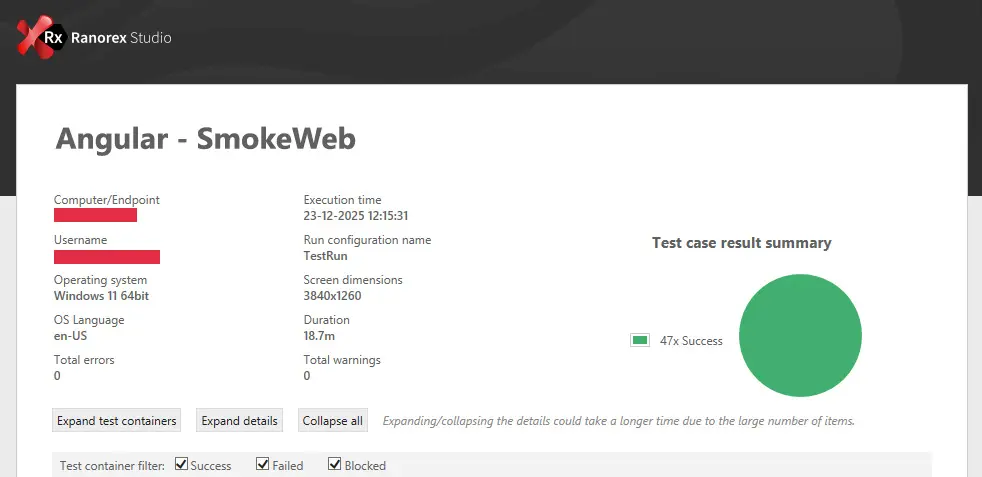
- Reports like the one below summarize execution data visually — helping teams make quick, confident release decisions.

Module-wise summary with 100% pass rate displayed in color-coded tables — highlighting results for Documents, Inventory, Purchasing, and other modules.
How It Helped the Client
- Enhanced visibility: Stakeholders now receive structured test reports immediately after every pipeline run.
- Improved decision-making: Real-time metrics enable go/no-go calls without waiting for manual summaries.
- Reduced QA overhead: No manual report compilation; everything is automated end-to-end.
- Better migration traceability: Categorized defect reporting accelerated Angular migration validation.
- Confidence in delivery: Each release cycle is now measurable, traceable, and transparent.
Enhops brought structure to our QA and test automation efforts. Their collaboration helped us streamline testing across platforms without disrupting our development workflows.
Zane Schott, CTO
![]()
Why This Matters (The Risk of Not Doing It)
Without such automated reporting:
- Test visibility remains limited, leading to delayed awareness of critical issues.
- Manual compilation of results introduces inconsistencies and slows feedback loops.
- Leadership teams lack quantifiable insights into automation coverage and effectiveness.
- During major UI migrations like Angular, missing structured defect categorization can cause redundant rework and extended stabilization cycles.
Recommendations / What to Do
- Integrate automation reporting into CI/CD: Embed test execution and report generation directly into Azure DevOps pipelines for continuous feedback.
- Use automation helpers: Tools like Ranorex Automation Helpers streamline report generation and log handling.
- Enable automated notifications: Configure SMTP to share results automatically after every execution.
- Categorize defects effectively: During technology migrations, track issues under functional, styling, or configuration-based buckets for focused remediation.
- Visualize results: Maintain a consistent, color-coded summary format (HTML/PDF) that instantly communicates status to both QA and leadership teams.
Additional Resources / Links
How Enhops can help
If your automation runs are generating results but not clarity, the issue isn’t testing—it’s visibility.
Enhops helps teams fix this by building Quality Engineering frameworks where reporting, CI/CD integration, and traceability are designed in—not added later. We turn raw automation data into real-time insights that support faster decisions, lower QA overhead, and confident releases.
If your teams are still chasing reports instead of acting on them, it’s time to rethink how quality is engineered.